Topics
- Soil and Plant Tissue Sampling Maps
- First Year Growth
- Soil Conditions (pH)
- Soil Conditions (surface texture)
- Soil Conditions (soil nutrients)
- Hops Production
- Tissue Analysis
- Presentations
Soil and Plant Tissue Sampling Maps
For each site, a set of geo-referenced maps were produced that show i. the configuration and layout of the hop yard (site map), ii. the location of the soil and tissue samples collected with the corresponding identification number, and (iii), maps that illustrate various soil test results (soil pH, cation exchange capacity, phosphorus index, potassium Index values, etc..) and their corresponding location within the hop yard.| Farm A | Farm B | Farm C | Farm D | ExpSite | |
| Site Map | Map | Map | Map | Map | Map |
| Sample Locations | Map | Map | Map | Map | Map |
| Soil pH | Map | Map | Map | Map | Map |
First Year Growth
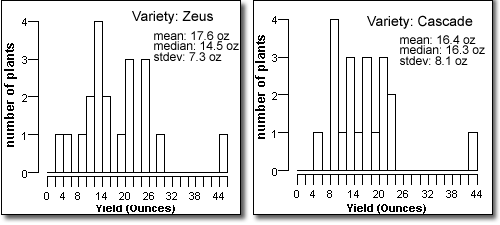
Plant heights at the experimental site were measured throughout the growing season with the last measurement collected July 27, 2010. Heights and growth rates varied widely both between and among varieties (Table 1). In general, Zeus, Nugget, Chinook, and Cascade were the top performers in terms of height, vigor, and overall visual health. Sterling and Northern Brewer emerged late and remained poor performers. These two varieties also suffered considerable pest damage from Japanese beetles and spider mites. Newport was also late to establish, but once the bines reached ~3 feet, their overall growth and vigor surged. Within varieties, Cascade showed the greatest variability (mean: 5.3 ft, StdDev: 3.1). In general, the high-alpha acid varieties performed best, with Cascade the exception.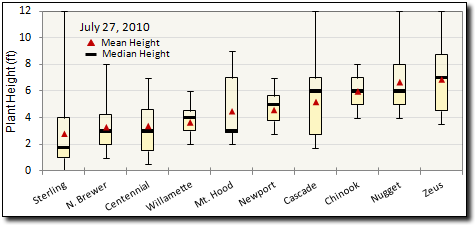
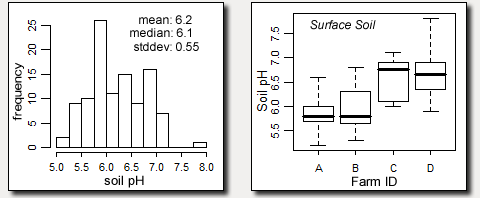
Soil Conditions (pH)
In April 2010, 106 soil samples were collected at 4 hops yards in the mountains. Among all farms, surface (0-4") soil pH averaged 6.2. pH values ranged significantly among all farms with 50% of the samples falling between 5.8 and 6.7 (Figure 2). Between the mountain hops farms, pH levels fell within two groups; farms A and B with an average pH around 5.9, and farms B and C with an average pH around 6.6 (Figure 2). The deep samples collected (6-10") show a close correlation with surface soil pH (+/- 0.3) with one exception, Farm D (Figure 3). Farm D's subsoil pH is below 5.2 and is representative of the soil conditions before heavily liming in 2009.To compare, in Willamette Valley, the major hop producing region in the US, soil pH ranges from 5.0 to 7.0. The influence of surface soil pH on yields is however unclear in this region (Gingrich, 2000).
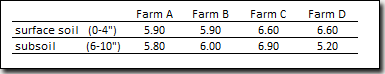
Soil Conditions (surface texture)
Surface soil texture was measured at the 4 mountain hops farms and at the 2 experimental research sites. A minimum 2 replicates were collected at each site and the averages presented in Table 2. Soils at farms A and C contain a loamy surface texture, farm B a sandy loam, and farm D is between a loam and clay loam. The Piedmont located research site (Lake Wheeler) is primary a sandy clay loam while the Mountain site (Mills River) is a sandy loam. Farm D soils contain the greatest percentage of clay (25-32%), farms A and C contain the greatest percent silt (~38%), and Farm B and the research sites contain the greatest amount of sand (52-65%).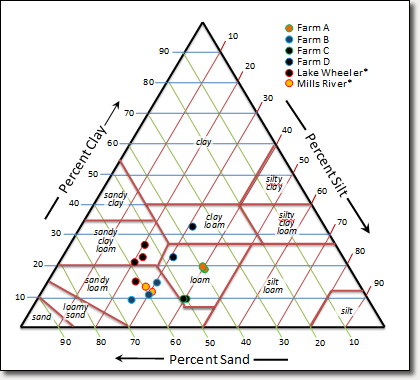
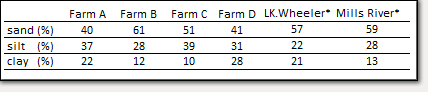
top 4 inches of the soil surface. (* research hop yards)
Soil Conditions (soil nutrients)
Results from the soil tests were used to summarize the existing conditions before the 2010 growing season. Summary statistics for each soil nutrient are listed in Table 3. A 99% confidence interval for the sample means is calculated and used to identify a range of values representative for all participating farms. Because this study includes analyzing conditions at various hops yards without corresponding control plots or treatments, the nutrient analysis is comparative in nature and is intended for relative interpretation.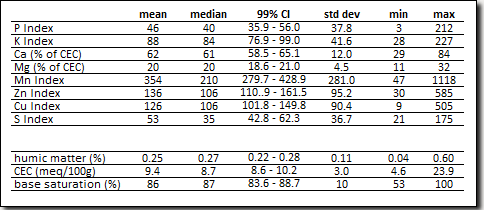
To compare the soil conditions between farms, the percent of samples collected at each hops yard that fell outside the upper or lower bounds of the 99% mean confidence interval were tabulated (Table 4). Results indicate substantial variation between the four hops yards. A significant portion of the observed variability between farms is a likely result of the varying use and forms of liming material, organic amendments, and fertilizers applied. These results do not indicate nutrients at either sufficient, deficient, or toxic levels, but rather provide a qualitative comparison between site conditions.
Hops Production
Mills River Experimental Site (1st-year production)
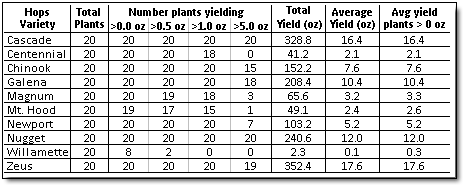
The first year of production at the Mills River research hop yard yielded 1544.2 ounces (96.5 lbs) of wet hops from 200 plants (Figure 7). Over 73% of the total production was harvested from 80 plants of 4 varieties; Zeus (352.4 oz), Cascade (328.8 oz), Nugget (240.6 oz), and Galena (208.4 oz), and the total yield for the two greatest producing varieties, Zeus and Cascade, was 2.5 times greater than that observed at the Raleigh experimental yard. Willamette, Mt. Hood, and Centennial produced less than 6% of the total yield at Mills River (Table 7). These 3 varieties produced similar low yields at the Lake Wheeler experimental site. Hops were hand harvested at the Mills River experimental site on 8 separate dates. Eight percent of the total harvest was collected July 28th, 15% on Aug 1st, 18% on Aug 9th, 12% on Aug 16th, 22% on Aug 23rd, 15% on Aug 29th, 7% on Sept 7th, and 3% on Sept 12th.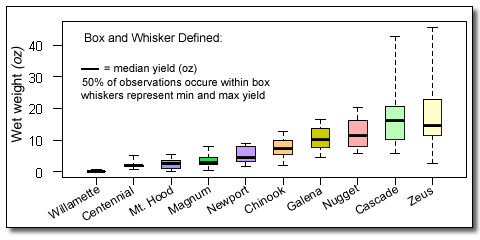
Tissue Analysis
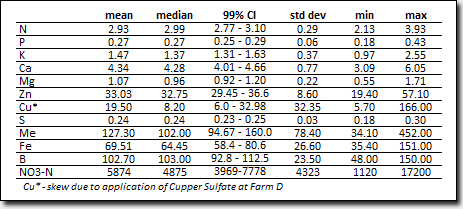
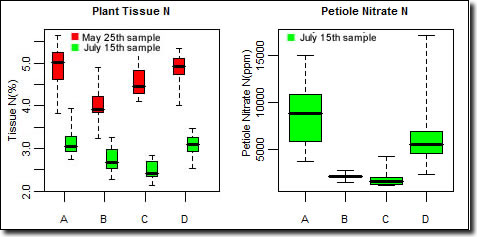
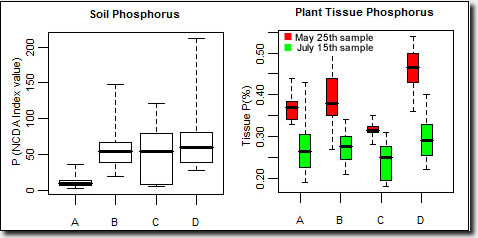
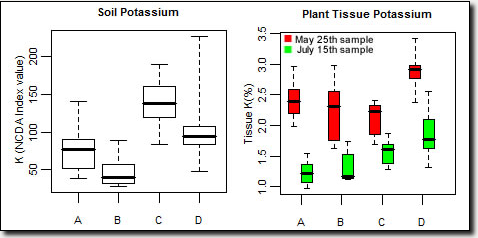
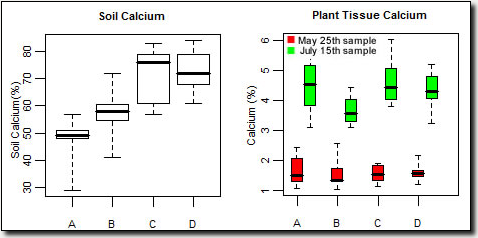
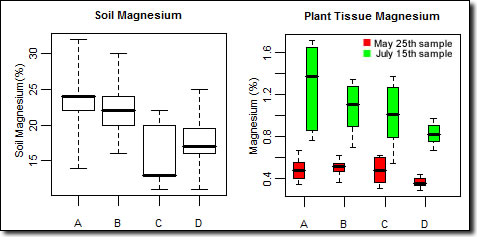
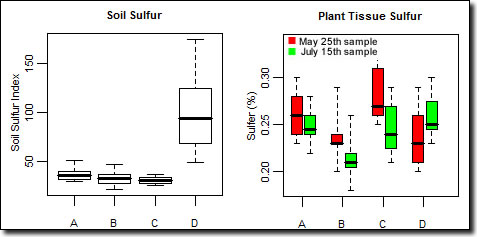
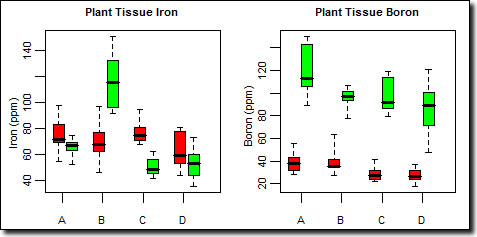
Results from the tissue analysis were summarized using the same approach as for soil nutrients. Tissue samples were collected twice during the 2010 growing season; May 25th, during the vegetative stage, and July 15th, at reproduction stage and full flower. Summary statistics for each nutrient are listed in Tables 4 and 5 (macronutrients are given as a percent, micronutrients are listed as ppm). Although no tissue standards are available for hops, these tables help construct nutrient sufficiency ranges from which future fertilization programs can be compared and analyzed.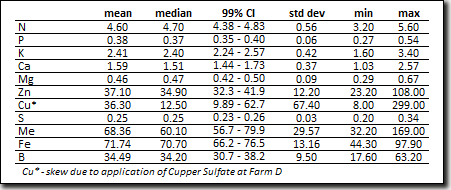
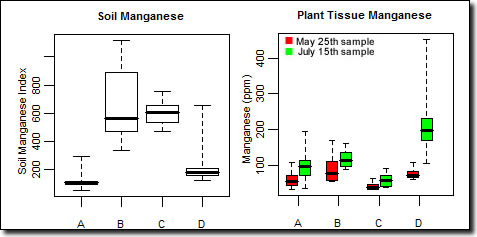
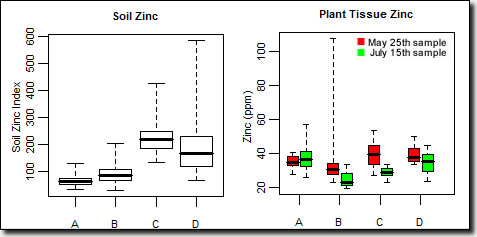
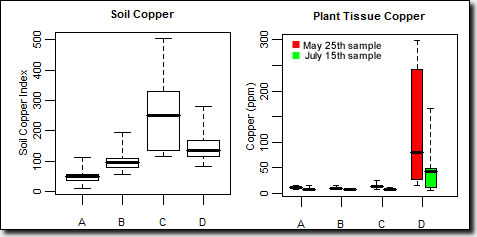
To analyze the soil and plant nutrient concentrations between farms, results from the soil analysis are plotted alongside corresponding plant tissue concentrations (Figures 5-14). The box-and-whisker plots graphically illustrate the range and distribution of the soil and plant nutrient levels collected at each farm. Correlation analysis indicates no significant relationships exist between soil nutrient levels and the respective tissue nutrient concentration. These results suggest that underlying soil fertility is not controlling, nor limiting, nutrient concentration in plant tissue. Rather, the nutrient concentrations observed are likely a combined result of underlying soil fertility and the uptake of applied nutrients.
